

This is a short story about metadata (I have to assume at this point you can read). About why a data file or dataset on its own is inadequate for analysis or research, and therefore insufficient to draw conclusive evidence or make informed decisions. Why you should never publish data or make it available through an API without its documentation. And, being mindful that computer applications are the immediate data consumers, emphasize the importance of machine actionable metadata. Here is an example, amongst many, I like to use to illustrate these issues.
A Literacy Use Case
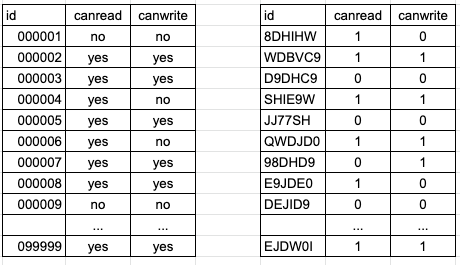
Let’s look at the following two datasets about two groups of individuals that were all asked the same questions about whether they can read or write using the English language. The dataset schemas are known, both have the same number of records (let’s say 100K), the variables have the same names, and the answers are categorized in a similar boolean way (two options).
You’ve been handed over these two datasets, and asked to estimate the literacy rates to determine which group need immediate assistance, and publish the results in a dashboard and a report. A rather trivial task you tell yourself, and computing simple aggregated statistics on both these datasets quickly reveals the following:
- In Group A, 70% of the respondents can read, and, amongst these 60% can write (if you can’t read, you can’t write)
- In Group B, 50% of the respondents can read, and, amongst these 40% can write
While the above numbers are purely hypothetical, you would naturally conclude that group B is the worst performer. You release your dashboard and underlying API, write a report, and pass these conclusions along, without further thinking about it.
The Missing Knowledge
But here is what I didn’t tell you. For group A, the respondents were invited to answer two questions using an online questionnaire: Can you read English? Can you write in English? A self-assessment with no very clear guidance. For group B, the same questions were asked, but an interviewer actually visited the households and, for the first question handed a piece of paper and asked for the respondents to read it aloud, and for the second dictated a paragraph for them to write down on paper, scoring a yes or no based on well defined scoring mechanism. This is no longer up to the respondent, harder to pass, and therefore results in lower literacy rates (at least that’s my assumption here).
Essentially you didn’t have access to the methodology, questionnaire, or interviewers’ instructions. And by not having this information handy, you can see how easy it is to think both these datasets are talking about the same thing, by are actually dissimilar. You are comparing apples to oranges , and your conclusions are incorrect. Sure you could have prior knowledge of this (did you ask?) or might be able to look this up (did you, really?). But computer applications don’t have this luxury (you have to do all the work), and it is a clear barrier to machine learning and AI as they need your inputs.
Many other factors could also affect your analysis: when was the data collected (these could be 10 years apart)? Was the survey conducted by a reliable source (an official statistics office or a student research project)? How were the respondents selected and what are their characteristics (adults? children? age range? education level?)? And so forth. Such information is often not trivial to find, which is at the core of the problem and a major contributor to data wrangling and poor data or research quality. Documentation should live in or alongside the data. Data and metadata should never have been disassociated to begin with.
The Consequences
What are the consequences of this? In the context of this article, nothing really bad. On the contrary, more the hope that you will start looking at data management, analysis, publication, or API design differently. In the real world, this could translate in significant impact for communities. For example millions over-invested in education for group B who apparently is worse than A, who in turn will not get the funding it actually needs to equally address its literacy issues.
And this of course is true for any dataset, and not only when comparing. It could be about the global economy, cancer patients, nuclear plants, stock market, climate change, space exploration, sensors, and the myriads of topics our data tracks everyday. Think about the consequences of misinterpreting data by having to guess its meaning rather than being well informed by sound documentation. This can’t be good, but is often the hard reality.
What can we do?
There are as you can guess many metadata elements that surround data (schemas, dictionaries, classifications, provenance, concepts, coverage, quality, etc.). These have actually been studied for decades by various groups an initiatives, and the good news is that standards and best practices are available to you to document your data, the W3C DCAT or the Data Documentation Initiative (DDI) being good places to start. DDI for example has placeholders to capture many of the elements mentioned above. Ultimately, it is about making the data Findable, Accessible, Interoperable, and Reusable, which are the core principles of the FAIR initiative.
Practically:
- If your data is stored as files: accompany them with secondary files holding the metadata in standards based formats (e.g. DDI). Do not just throw in PDFs, MS-Word, Excel sheets, and other unstructured documents, they can only be used by humans!
- If your data is in SQL databases: ensure secondary tables or better, JSON/XML/RDF databases provide access the standard based metadata (metadata is typically semi-structured, making NOSQL databases more suitable)
- If you deliver data through APIs: make sure to design APIs that provide concurrent access to both data and metadata (and don’t forget to be API-First).
- In all cases: familiarize yourself with FAIR, FAIR Digital Objects, and related standards and best practices.
One of the major challenges is of course to find the documentation and ensuring its existence in machine actionable formats. But thats for a different story, or rather stories (yes, it’s solvable).
If you are looking for guidance and technical assistance, or need an out of the box API solution, I would recommend reaching out to MTNA or consider its Rich Data Services (RDS) platform. MTNA was my home for many years prior to joining Postman, and you’ll find deep expertise on these topics there.
And of course you’re always welcome to contact me, this is one of my favorite topic and mission in life. I’m currently investigating ways to automate the inference of metadata from data using software agents. If you are in the GraphQL space, I’m exploring options to inject metadata in GraphQL schemas and develop GraphQL based APIs for standards. And open data projects and APIs are always on my agenda.
Conclusions
I hope this helps you grasp the importance and benefits of machine actionable metadata to complement your data, and that you will never look at a CSV file, database table, or data API in the same way.
Data impacts everything we do and that surrounds us. It drive policy and decision making, powers software applications, measure the health of our nations an planets, supports research and innovation, and ultimately exists run businesses, support governments, inform the public, and ensure the well being, safety, and future of our families, friends, and communities. Let’s make sure it carries the comprehensive information we need to use it in effective and responsible ways, and empower information systems to unleash machine intelligence.